User’s manual
In this chapter:
Sorting
Column width
Row height
Column order
Setting the zoom
Number of value line columns
Number of charts per page
Sharing customization
Instant Team customization on the Standard license level is very limited and only consists of the option to set the parameters and modify the layout of the predefined reports in the application. However, before you try to customize the reports you have to become familiar with the way report properties are actually saved.
This is because every report exists in several versions. The original version is saved in a template used by Instant Team. Next, there is a version for your workgroup, which derives from the first one and which may—but does not need to—differ from the template version. And finally there are report versions for every member of your workgroup. These versions are based on the version intended for your workgroup and users can—but do not need to—change them for their purposes.
Further below, you will find a detailed description of working with these versions—in the subsection on customization sharing. For the time being it suffices to say that all report modifications are first applied to your personal version of the report and they have no impact on other users until you decide to share the modifications with them.
Report parameters
The most frequent report customization consists in setting its parameters. In fact, parameters are additional filters applied to the report and linked to a preselected database field or several fields.

Every report has different fields as its parameters. Some reports even do not have any such fields. For every parameter, an input field appears in the toolbar above the report and you can enter the filtering value here. If there are multiple parameters in a report and you fill out more of them then the filtered records will contain the required values as regards all the parameters you entered. You cancel the filter by setting the parameter(s) to the value All.
Sorting
Every report displays rows that are sorted in some way. Either they are sorted by one of the fields or the report shows records in the order they were created or rearranged by users.
If the report is sorted by one of the fields and the field is displayed in the report then the sorting column is emphasized by an arrow appearing next to its name. It is also possible to sort according to the value line columns, with the exception of reality columns and when applying percentage and difference comparison.

To select another sorting column, you just click the left mouse button on its header. The report is then sorted according to the new column, always in ascending order. If you click on the header of the currently selected sorting column then the sorting order changes from ascending to descending and also the arrow next to its name switches direction. After another click the report becomes unsorted, that is, arranged according to the order records were created or rearranged by users. This option—unsorted reports—is only available in some databases.
If you right click your mouse on the column title, the local menu options will also make it possible to sort the particular column in ascending or descending order.
If the value of the sorting column is identical in two rows then the natural record order or the row’s name is used as the second sorting criterion. Naturally, the sorting procedure also takes account of the hierarchy: if you sort a report grouped by owners but you use the To Start field then you first get the owner assigned a task that starts earliest followed by this owner’s sorted tasks, then the group belonging to the next owner, etc.
In addition to clicking on the column’s title, you can also change sorting criteria via the View/Report/Modify/Sort by/… menu or you can open the report customization window using the View/Report/Customize… menu and modify sorting criteria there.
Column width
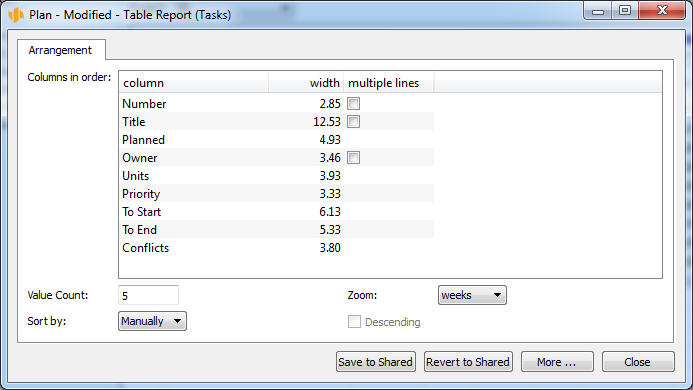
In this window, you can modify all the other report properties as well. For example, you set column width by selecting from the list of columns the one for which you want to change its width and entering the required width directly in the Width column of the table.
Column width is specified in characters and you can also change it directly by dragging it with the mouse. First you need to move your mouse to the right edge of the column header. The pointer changes and if you press the left mouse button now and drag the modified pointer you will change the width of the column this right edge belongs to. When you are content with the new width, just release the mouse button.
If you double click on the edge of one of the column headers in a report then the widths of all columns will be adjusted so that all the columns would fit nicely in the area currently reserved to the report. Their relative widths in the report are preserved but if they did not show in the report all at the same time then they will shrink to fit. If, in contrast, there was unused space in the report then the columns will expand proportionately. You can also adjust the width of all columns using the local menu above the table header.
Width of value line columns
There are two ways you can set the width of the values in the right part of a report. The first option is to shift the delimiter between the left and right parts of the report by dragging it with the mouse while holding the <Alt> key. The second option is to change the width of columns in the right part of the report by again dragging them with the mouse and also holding the <Alt> key.
Row height
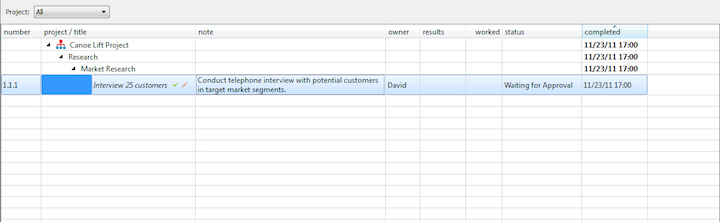
You can set for the individual report columns whether row height is to adapt to the value in the given column. Go to the report customization window, the Arrangement tab, and check the Multiple Rows column check box, see Figure 10.3. Row height can only be adjusted in some columns. For example, for columns of the Time type, displaying items over several rows makes no sense and, therefore, the Multiple Rows check box is not displayed in columns of this type. In the following figure, you can see an increase in the height of a row with a Note column containing a value longer than the width of the column.
Column order
You can also modify the order of the columns using either the mouse or the local menu or the report customization window. Here, you can move columns up and down simply by dragging them with the mouse, which changes the position of the selected column in the displayed column list. The leftmost column in the list is always the first one so by shifting the selected column one position down the list, also moves it one position to the right in the report. Conversely, dragging a column up moves it to the left in the report.
Moving columns with the mouse directly in the report is mostly quicker and more transparent. The procedure is as follows:
- Move your mouse to the header of the column you want to shift.
- Press and hold the left mouse button.
- While holding the left button, move the mouse to the separator between columns where you want to transfer the column you are holding.
- Release the left mouse button and complete thus the column shift.
Columns can be moved right or left also through the local menus Move Column Left and Move Column Right available in the headers of the report columns.
Setting the zoom
The following customization can be performed for table reports with the value line displayed in their right part, that is, usually time-dependent values. It sets the value zoom in the report. If time value is selected, the options of hours, days, weeks, months, quarters, or years can be chosen. In such a case this setting determines the time range of each and every displayed column. If you set the zoom to days you will thus see in the report events during one day or several consecutive days. If you set it to weeks you will see events during one week or several weeks in a row and it works likewise with other zooms.
The hour zoom is only available for the Gantt chart and the fields Planned Work, Planned Utilization, Peak Utilization, and Resource Availability.
Similarly to time-based aggregation, it is possible to change the zoom for values aggregated according to a different criterion, but only in case of multilevel aggregations.
In the case of calendar, the zoom setting determines how long a period is to be displayed on the screen or perhaps be printed on one page at a time. In one view, it is possible to display a calendar for an entire year divided into individual months or for only a quarter by months or for one month or one week by individual days or one day only.
To change the zoom, you can use the magnifying glass button in the Format Toolbar or the View/Report/Modify/Zoom/… menu or you can possibly use the local Zoom… menu that appears when you click the right mouse button on the calendar or a time-based cell in a report displayed in the form of a table.

You can thus switch among individual zoom levels by using the Zoom in/Zoom out buttons or using the Zoom menu available via the right mouse button. You can also zoom in on the value line by double-clicking on it.
Naturally, you can set the zoom also in the report customization window using the pull-down Zoom list.
Number of value line columns
In case of reports containing value line columns, you can also select the number of displayed value line columns. To achieve this, you can use either the Value Count field in the report customization window or mouse dragging again.
The mouse dragging procedure is as follows:
- Point the mouse to a delimiter in the column header in the value section of a report (or to a scrollbar between the left and right parts of the report) so that it turns into a cursor.
- Press the left mouse button and while holding it, move the mouse left or right. As you drag the delimiter, a tooltip shows how many columns of the new width will fit in the value line section of the report.
- When you are content with the number of columns, release the left mouse button.
If you double-click on the edge of a column header in the right part of the report then the number of columns will be adjusted in such a way as to see all the values if possible. Adjustment of the number of columns can also be activated from the local menu above the table header by selecting the Adjust Number option.
Number of charts per page
In case of reports with value line columns the values of which are displayed in the form of a bar chart, you can also choose the number of displayed or printed charts per page. This setting is only available in the report customization window.
Normally, only one bar chart corresponding to the values from the currently selected row is displayed. However, if you select multiple rows in a report at the same time then charts for each selected row will be displayed one under another simultaneously.
In order for the charts to be readable even if you select a large number of rows, it is possible to limit the number of charts displayed at a time using the option mentioned above. If you select more rows than determined by this restriction then a scrollbar appears to the right from the charts so you can view further charts using the scrollbar.
Sharing customization
If you do not like your report customization you can return to the version shared by your workgroup anytime. You do this using the View/Report/Reset Shared menu, the Reset button in the report customization window or also the Reset Shared button which is displayed in the Format Toolbar for customized reports. All your settings specific to this report will thus be removed.
If, on the other hand, you are satisfied with your customization and, moreover, you feel it will also suit other users from your workgroup, you can overwrite your workgroup’s shared version with your version. You do this using the View/Report/Save to Shared menu or the Save to Shared button in the workgroup customization window. However, this option is only available to users in the Administrator role.
If you save a report it will be henceforth displayed to other users the same way it was displayed to you before then. If, however, a user has independently customized the given report—or will customize it later on—then this user’s report will only use those settings from the shared customization that the user did not change separately.
If you are unsure whether you use a shared report version or you have customized it, just open the report customization window (e.g., click the right mouse button in an empty part of the report and select the Customize… button from the local menu). In case of reports you have customized differently from the shared version, the window name contains a note saying “- Modified -”.
To keep track of the report versions you use, there is also the workgroup customization window, which you can access via the Edit/Customize… menu.
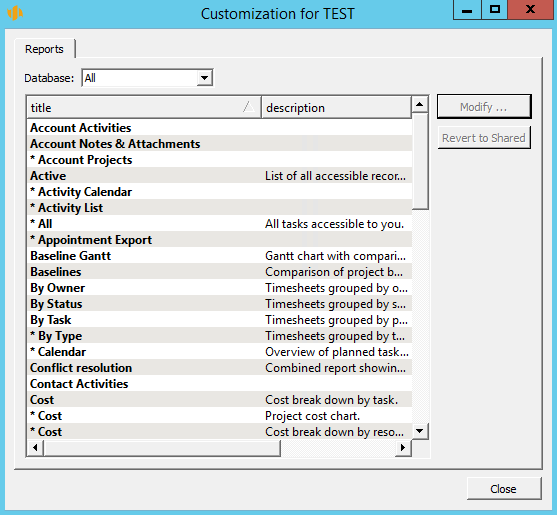
In this window, all modified reports are marked by an asterisk in front of the report name. You can also save modified versions here or return to the shared version. Moreover, you can apply the described operations to multiple reports at the same time. While in the workgroup customization window, you can further open the individual report customization window using the Modify… button.
60 days overview of all dates, capacities, inputs and outputs about each project and completely free.
All rights reserved, Created by eBRÁNA Privacy statement